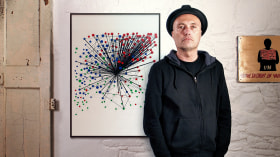
Information Design: Storytelling with Data in Illustrator
A course by Valentina D'Efilippo
Explore the art of data visualization by learning to transform data into compelling and easy-to-read infographics
- 6,126
- 100% (100)

Isometric Map Illustration: Capture a City's Vibrancy
A course by Jess Wilson
Learn how to create a colourful detailed map to express the energy of a city
- 3,574
- 100% (116)

Creative Infographics: Between Art and Journalism
A course by Jaime Serra Palou
Learn to visualize data in an artistic way through images and text
- 5,342
- 97% (226)