
Visual Storytelling Through Infographics
A course by Catalina Plé
Unleash your creativity with visual storytelling and tell your stories through infographics.
- 2,409
- 100% (27)

Editorial Content Design: A News Experience
A course by Francesco Franchi
Design a publishing experience that responds to and adapts to new information consumption. Combines analog and digital platforms to shape content to be read, watched, listened to, and touched.
- 1,236
- 100% (21)

Graphic Visualization: Telling Complex Stories through Simple Images
A course by Katya Kovalenko
Learn the techniques to present information in a simple and compelling way through visuals and infographics
- 19,479
- 99% (538)

Infographic Design: Combine Art and Data
A course by Thales Molina
Explore the world of infographics and learn to build visual narratives from start to finish
- 4,911
- 97% (58)
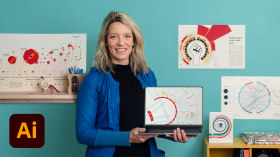
Information Design: Storytelling with Data in Illustrator
A course by Valentina D'Efilippo
Explore the art of data visualization by learning to transform data into compelling and easy-to-read infographics
- 6,137
- 100% (101)

Techniques for Developing your Creativity
A course by Silvia Ferpal
Start your artistic, visual, and conceptual exploration and learn how to generate and implement ideas
- 8,118
- 98% (332)

Effective Data Visualization: Transform Information into Art
A course by Sonja Kuijpers
Learn to effectively bring data to life with creative shapes, colors, and layouts
- 9,282
- 97% (146)

Data Visualization: Design Infographics in Illustrator
A course by Marco Giannini
Learn how to communicate complex information through meaningful data-driven images
- 5,412
- 99% (76)
Domestika Basics · 7 courses
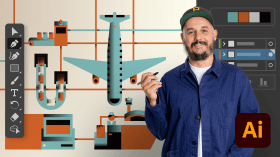
Introduction to Infographics with Adobe Illustrator
A course by Paadín
Create infographic maps that tell real illustrated stories and learn to use the software from scratch
- 5,396
- 99% (141)

Design Your Own Creative Process
A course by Alejandro Masferrer
Make the most of your workflow, avoid creative blocks, and work more efficiently and confidently with your skill set
- 2,990
- 100% (187)
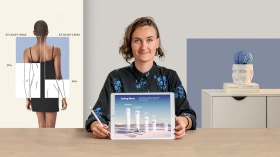
Creative Data Visualization for Beginners
A course by Gabrielle Merite
Learn to create captivating narratives by combining digital illustration and collage techniques to design informative and eye-catching images
- 1,853
- 100% (28)

Fundamentals of Data Visualization
A course by Gemma Busquets
Learn how to tell the stories behind data, using everything from statistics to maps and charts
- 1,668
- 100% (46)

Analog Data Visualization for Storytelling
A course by Stefanie Posavec
Explore the narrative potential of data and learn to create engaging imagery that tells a story using analog materials
- 1,971
- 94% (51)
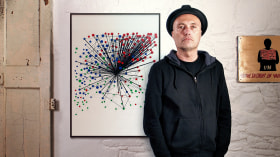
Creative Infographics: Between Art and Journalism
A course by Jaime Serra Palou
Learn to visualize data in an artistic way through images and text
- 5,344
- 97% (226)
Infographic Illustration for Children and Young Adults
A course by Daniela Martagón
Learn how to design educational infographics that captivate young audiences and encourage reflection
- 1,620
- 96% (93)

Data Visualization with Alternative Mediums
A course by Olivia Johnson
Learn how to combine data visualization with unexpected mediums, such as embroidery, to create physical meaningful works of art and design
- 298
- 100% (8)

Experimental Design Techniques: Break the Rules
A course by Cihan Tamti
Push the boundaries of design by creating three posters using experimental typography, analog tools, and digital compositions
- 4,062
- 99% (101)
Design of Experimental Typographic Posters
A course by BlueTypo
Express a creative concept by mixing digital and analog techniques
- 1,441
- 100% (69)

Informative Illustration: Awakening Curiosity
A course by Bruno Valasse
Research and learn how to communicate ideas through illustration techniques
- 2,320
- 98% (109)